Use GoAccess To Analyze HAProxy Logs
Updated
•3 min read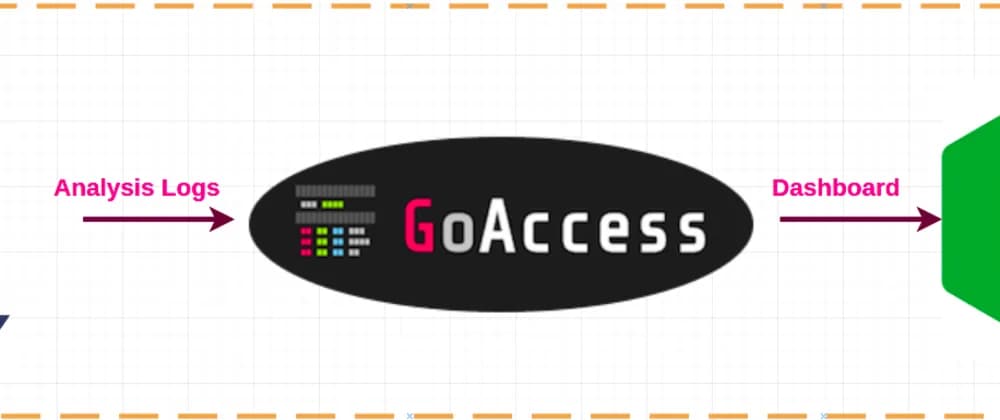
Goaccess provides Real-time log analysis through a Dashboard in multiple output formats, we can use it to analyze haproxy logs to detect any abnormal traffic
What’s In This Document
🚀 Understand HAProxy Log
1. HAProxy Logfile
# cat /etc/rsyslog.d/49-haproxy.conf
# Create an additional socket in haproxy's chroot in order to allow logging via
# /dev/log to chroot'ed HAProxy processes
$AddUnixListenSocket /var/lib/haproxy/dev/log

# Send HAProxy messages to a dedicated logfile
if $programname startswith 'haproxy' then /var/log/haproxy.log
&~
- We can change the log folder through this config then restart rsyslog service using
systemctl restart rsyslog
2. HAProxy log rotate
cat /etc/logrotate.d/haproxy

/var/log/haproxy.log {

    daily

    rotate 52

    missingok

    notifempty

    compress

    delaycompress

    postrotate

        invoke-rc.d rsyslog rotate >/dev/null 2>&1 || true

    endscript

}
When you use the above configuration, logrotate will apply this rule every day, keeping any logs 52 days old or newer. It also compresses the rotated files into a gzip format. You won’t need to worry about having too many log files on the server—logrotate will remove any older files for you. By using this simple configuration, you can avoid having to wake up in the middle of the night to remove logs. Sounds like a great deal, right?
To make sure the configuration works, restart HAProxy and rsyslog:
sudo service rsyslog restart
sudo service haproxy restart
🚀 Generate HAProxy Report Using Goaccess Container
We should first care about log-format and time-format of HAProxy to provide the correct input format in goaccess command. Please refer to: https://github.com/allinurl/goaccess
To generate report, we use zcat to force read regular files and compressed ones
zcat --force /var/log/haproxy.log* | docker run --rm -i -e LANG=$LANG allinurl/goaccess -a -o html --log-format='%^]%^ %h:%^ [%d:%t.%^] %^/%^/%^/%^/%L/%^ %s %b %^"%r"' --date-format='%d/%b/%Y' --time-format='%H:%M:%S' - > report.html
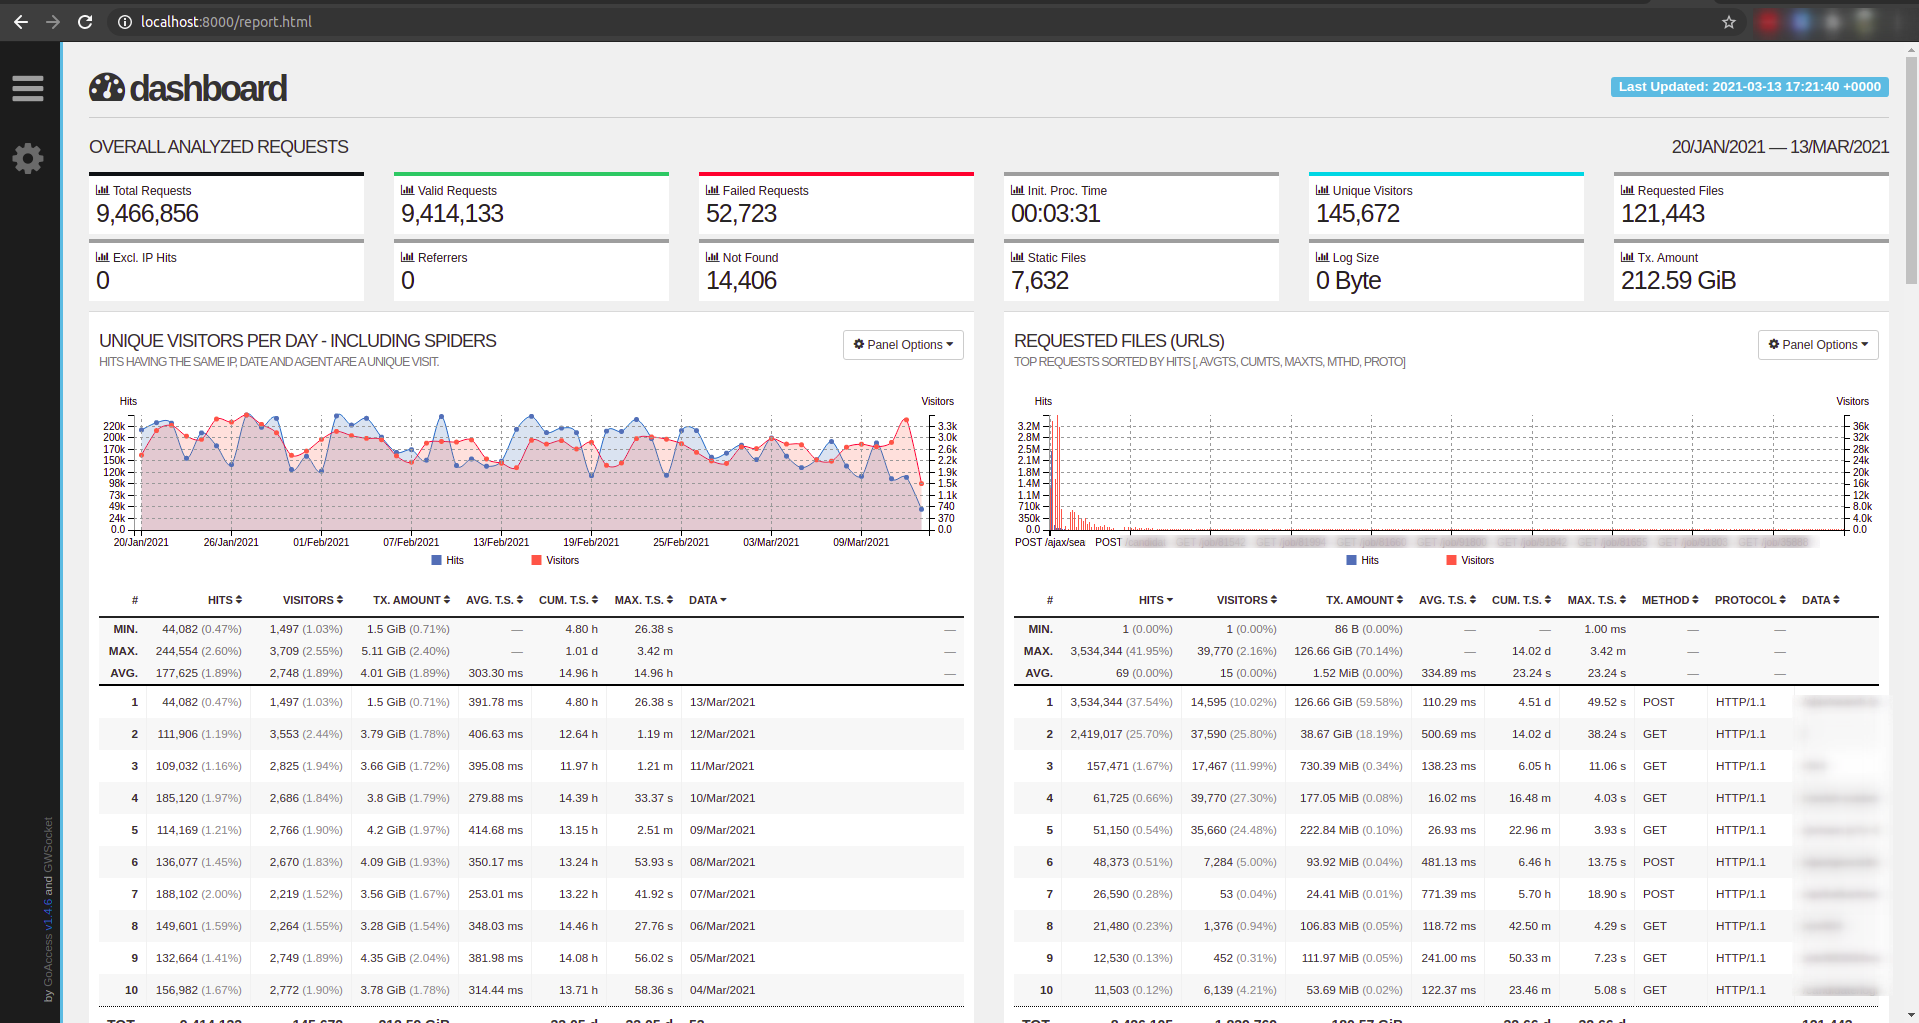
Quick start the URL for checking the report by using python simple http port 8000 then we can open http://localhost:8000/report.html
python -m http.server 8000 --directory .
🚀 Use HAProxy To Provide Professional Dashboard Report
1. Setup HAProxy config
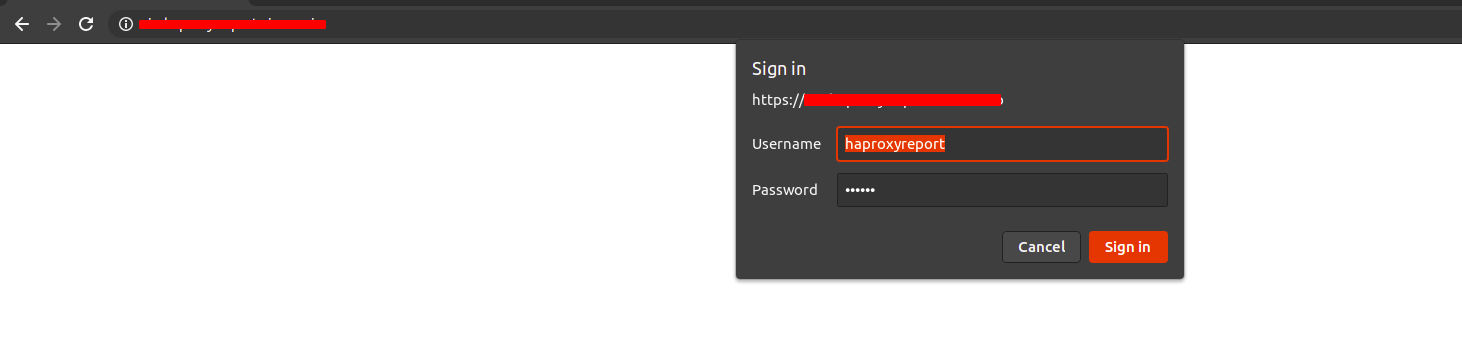
- Setup login for accessng dashboard and Backend which filter dashboard host header to forward request to nginx
userlist AuthUsers
        user haproxyreport password $5$3VeorK1XxvgRseQ$VBkOPCY2enWZsas.C6X9Iif0FPHDknXXXXXXXXX

frontend fe-verify
        bind *:443 ssl crt /etc/certs

        acl haproxy_report hdr(host) haproxy-report.cloudopz.co

        http-request set-header X-Forwarded-Proto https if { ssl_fc }
        use_backend haproxy-report-backend if haproxy_report

# haproxy-report-backend
backend haproxy-report-backend
        acl authorized http_auth(AuthUsers)
        http-request auth realm haproxyreport if !authorized
        server haproxy-report 127.0.0.1:1800
- For certificate of domain, please search "Genereate Cert using haproxy and letsencrypt"
2. Start NGINX web proxy which listens to port 1800 to open report.html
- Create
default.conf
# cat conf/default.conf
server {
    listen       80;
    server_name  localhost;

    location / {
        root   /usr/share/nginx/html;
        try_files $uri /report.html;
    }

}
docker-compose.yaml
# cat docker-compose.yaml
version: '3.5'

services:
  nginx:
    container_name: nginx
    image: nginx:1.12-alpine
    restart: always
    ports:
      - "1800:80"
    volumes:
      - /opt/monitor-haproxy/haproxy-report/conf:/etc/nginx/conf.d
      - /opt/monitor-haproxy/haproxy-report:/usr/share/nginx/html
- Up nginx
docker-compose up -d
# docker ps
CONTAINER ID   IMAGE               COMMAND                  CREATED       STATUS       PORTS                  NAMES
560a79082055   nginx:1.12-alpine   "nginx -g 'daemon of…"   6 hours ago   Up 6 hours   0.0.0.0:1800->80/tcp   nginx
Open Dashboard
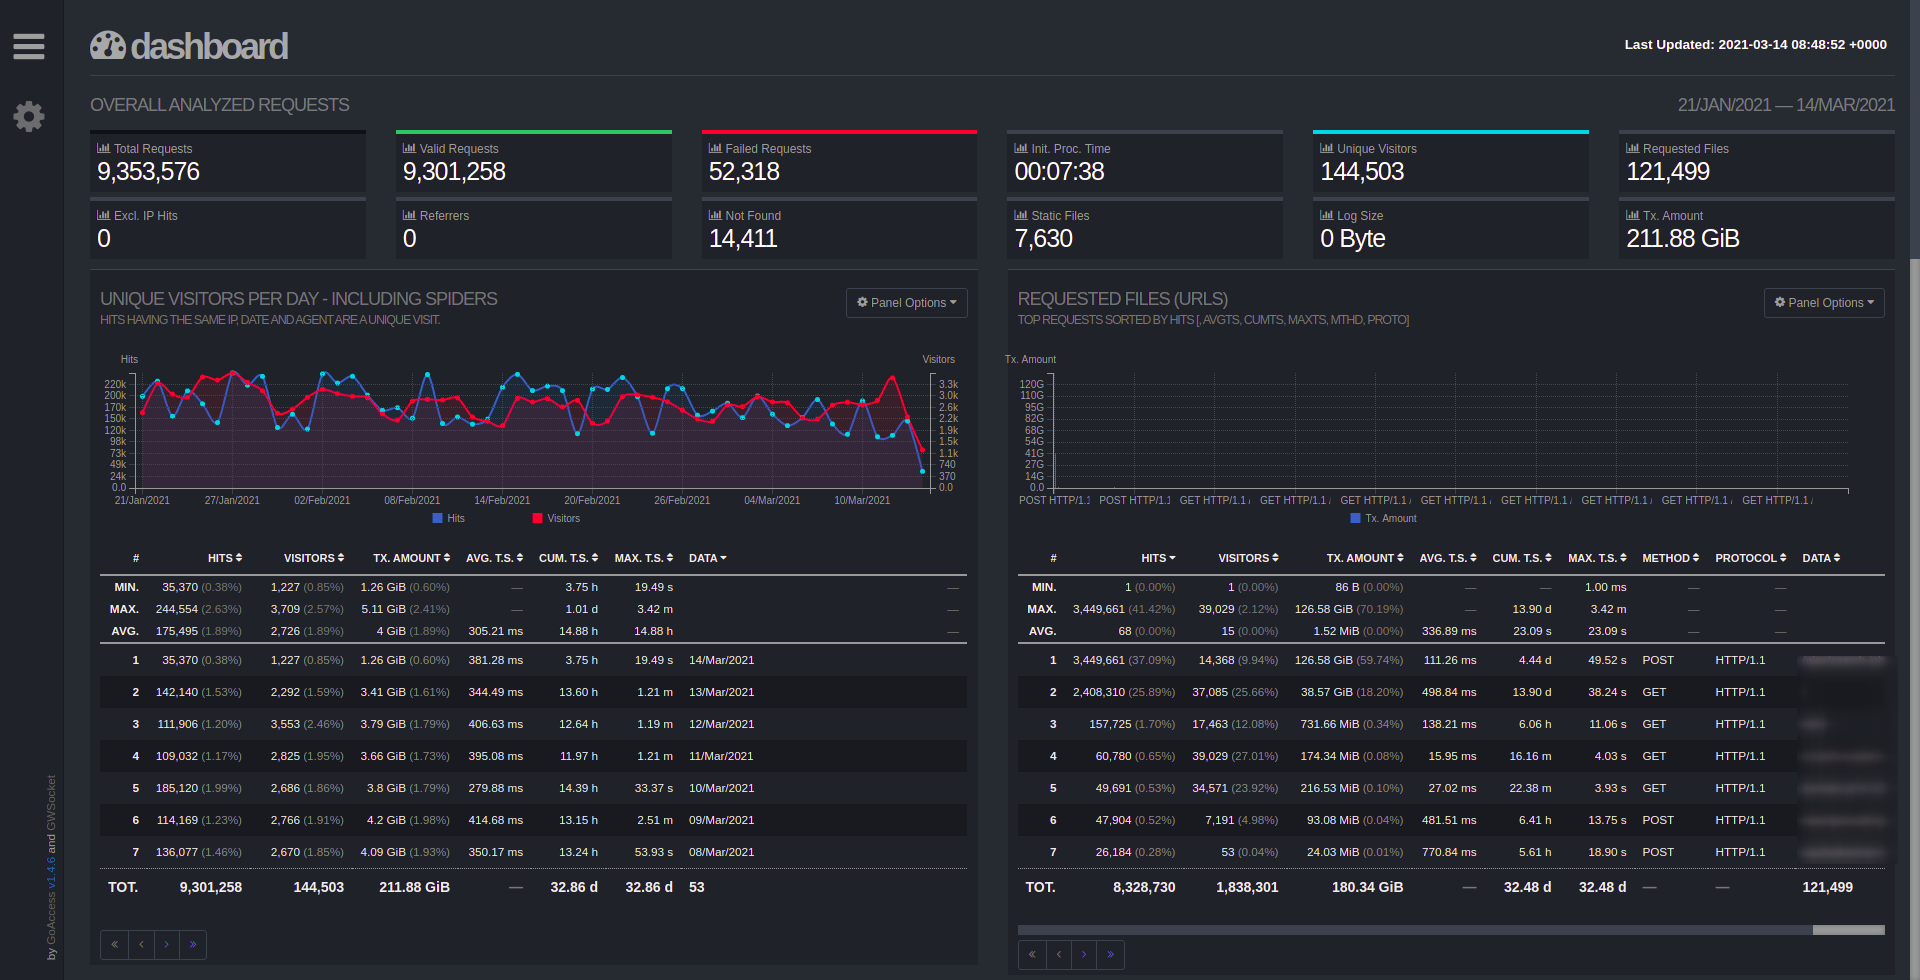
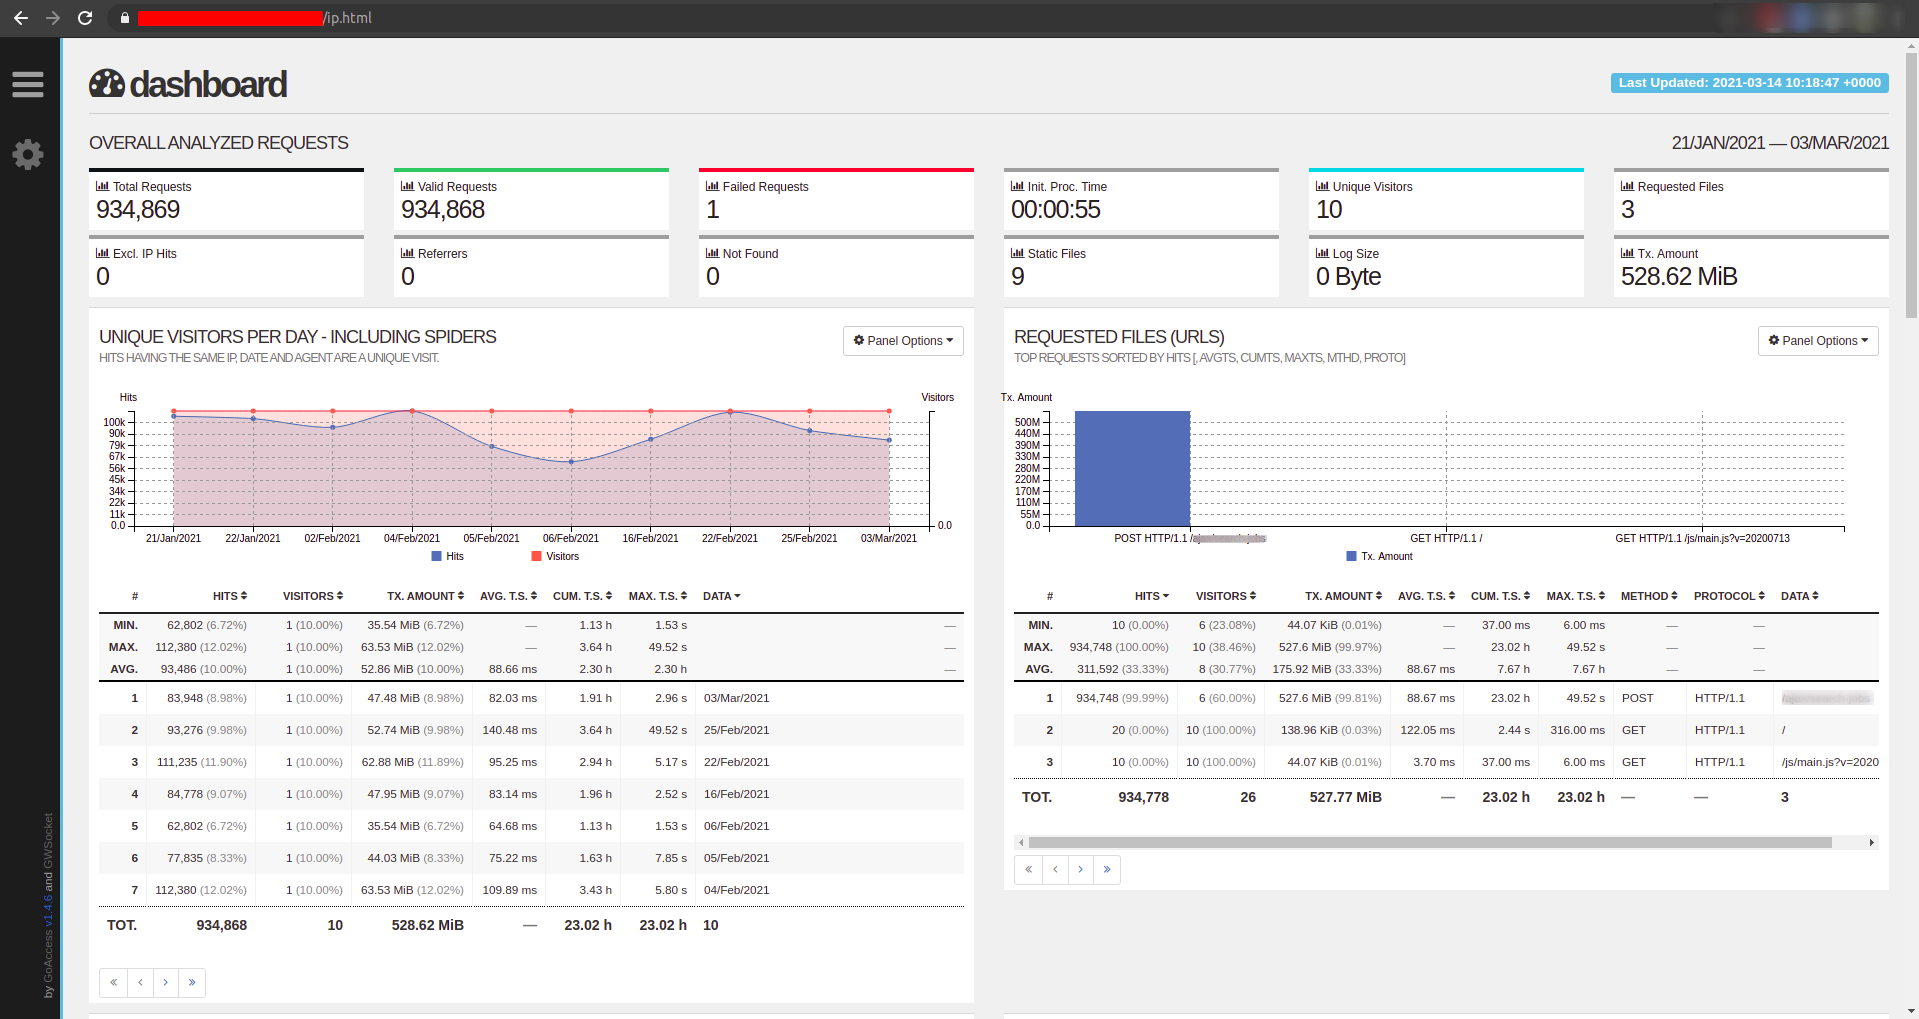
🚀 Generate Report For Specific Suspect IP
If we suspect an IP which might be a bot/spider, we can generate a report for that IP for deeper analyze
zcat --force /var/log/haproxy.log* | grep 14.255.136.0 | docker run --rm -i -e LANG=$LANG allinurl/goaccess -a -o html --log-format='%^]%^ %h:%^ [%d:%t.%^] %^/%^/%^/%^/%L/%^ %s %b %^"%r"' --date-format='%d/%b/%Y' --time-format='%H:%M:%S' - > ip.html